Category: Analysis

  • Why This Economic Cycle Is Different?

    Why This Economic Cycle Is Different?

    No two economic cycles are the same, but as the American writer Mark Twain eloquently put it, “history doesn’t repeat itself, but it often rhymes”. This cycle is proving to be particularly different, however, which makes it even more challenging to draw parallels with the past.

    Depending on which indicators you look at, the US economy could be categorised as being in any one of the business cycle’s four phases. These are expansion, slowdown, recession and recovery.

    If we use the textbook definition of recession – two consecutive quarters of negative real GDP growth – the US is in one. Recessions, however, are usually accompanied by a meaningful pick-up in the unemployment rate, and this has not occurred.

    Instead, the unemployment rate is at a multi-decade low. Indeed, the strength of the labour market speaks of an economy in its expansion phase, albeit now clearly pushing at capacity limits.

    Other economic indicators, however, such as business surveys (deteriorating) and the rate of change in inflation (still accelerating), suggest an economy already experiencing that particularly difficult type of slowdown, stagflation. Certainly, the sharp de-rating of US equities seen this year is in keeping with stagflation.

    In short, this economic cycle can’t be easily categorised.

    Unique Circumstances Have Created Two-Speed Economy

    As the rapid pace of rate rises by the Federal Reserve (Fed) continue to take effect we expect economic indicators to become less contradictory. This should occur next year when we anticipate the US economy to be in a recession.

    Since the post-war period, every time there has been two consecutive quarters of negative real GDP growth, recession has been confirmed by the NBER (National Bureau of Economic Research). The NBER is the official authority on dating US recessions based on monitoring a variety of macro-economic indicators.

    So far, they have not announced recession.

    The weakness in second quarter GDP was also distorted by a significant fall in inventories after strong stockpiling in previous quarters. So, it seems premature to call the end of the cycle based on recent disappointing GDP releases.

    In contrast, the Schroders Output Gap model, which measures the amount of spare capacity in the economy, suggests that the US economic cycle remains in the expansion phase (see chart 2, below). This is because the output gap is positive and rising.

    The output gap is the difference between an economy’s actual output and its potential output, a positive output gap suggests the economy is running out of spare capacity, which adds to inflationary pressures.
    Ordinarily, monetary policy would be tightened at this stage to bring actual output back to its potential (the maximum level of output an economy can produce without generating inflation). The Fed is currently attempting to engineer just this.

    As activity slows down the positive gap begins to shrink, and the economy enters the slowdown phase – although this is not yet occurring following a blistering pace of interest rate rises.

    Schroders Output Gap model and phases of the economic cycle

    Expansion – output gap is positive and rising
    Slowdown – output gap is positive and falling
    Recession – output gap is negative and falling
    Recovery – output gap is negative and rising

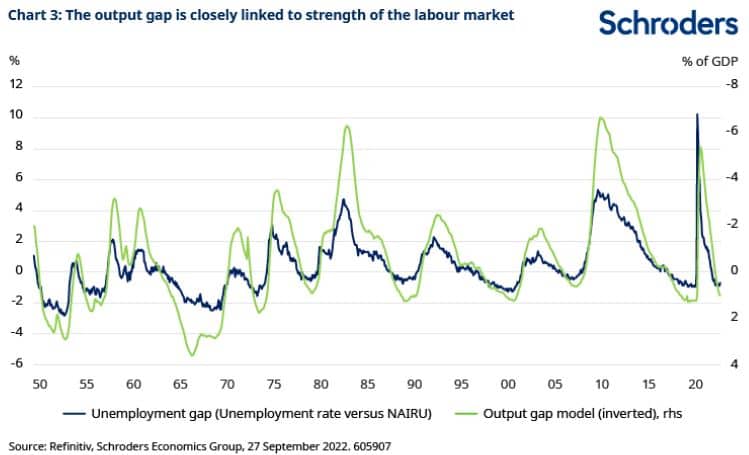
    Instead, a presently positive and rising output gap reflects labour market strength, as captured by the ‘unemployment gap’ (chart 3). The unemployment gap is one of the key inputs into the output gap model and tells us if there are less unemployed workers compared to trend levels.

    Monetary policymakers make a judgement on what is the NAIRU (Non-Accelerating Inflation Rate of Unemployment), being the lowest level of unemployment that can be achieved before inflation begins to rise in the economy.

    So, there will need to be a meaningful rise in the unemployment rate before the positive and rising output gap begins to shrink.
    US Economy And Markets Showing More Late Cycle Traits

    While we expect our output gap model to move into slowdown at the start of 2023, we recognise that other areas of the US economy are already showing late cycle characteristics. Growth momentum has peaked, and business surveys have eased while inflation has accelerated.

    Even the particularly poor performance of markets is typical of a stagflationary environment. The performance of the S&P 500 year-to-date (YTD) is more consistent with past slowdowns as defined by our output gap model (see chart 4, below).

    Equities typically suffer during slowdowns as corporate profitability gets hit by weaker growth and rising costs from higher wages and interest rates.
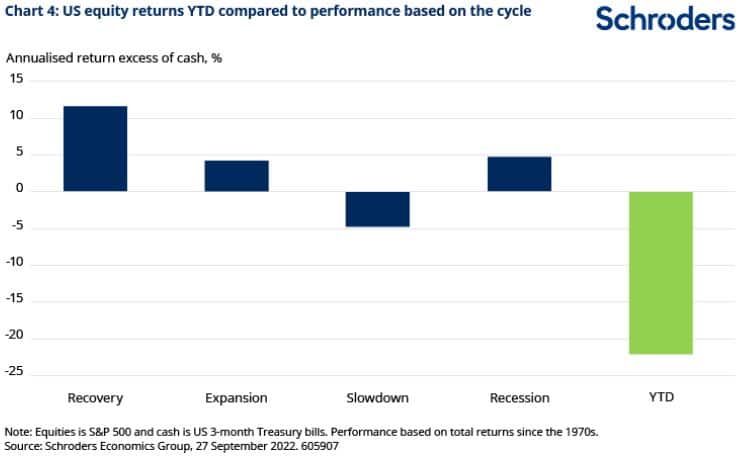
    But the magnitude of equity losses this time around has been greater compared to past slowdowns. Despite robust corporate earnings, valuations have significantly de-rerated.

    This is because the high levels of inflation have led to more aggressive expectations of policy tightening by the Fed.

    This Cycle Is Proving Rather Different

    We’re in rather unusual circumstances in that the contraction in economic activity this year has come after a very sharp recovery in growth from Covid-19 lockdowns. So, macro data has eased back to more normal levels. At the same time, US inflation at 8.5% is usually high relative to past cycles. This has led to comparisons with the stagflationary period of the 1970s as inflation back then surged to record levels prompted by an oil price shock.

    Unlike the 1970s, the imbalance between supply and demand for goods, resulting from the Covid-19 pandemic, is the root cause of inflation in this cycle. This has been further exacerbated by the Ukraine-Russia war and the impact on supply chains resulting from China’s zero-Covid policy.

    So, it is not straightforward to draw parallels with the 1970s, particularly given the robust labour market (see chart 5, below).

    The tightness in the labour market has also been driven by factors resulting from the pandemic. In particular, the decline in the number of workers participating in the labour force.

    Firstly, more people in the older cohorts have decided to take up early retirement due to health concerns. Secondly, some workers have chosen to exit the labour force due to a reassessment of priorities such as caring for relatives. Thirdly, long Covid has hit the workforce and according to the Brookings Institute accounts for 15% of 10.6 million unfilled jobs in the US.

    Some of these factors could ease over time as higher wages incentivise workers to return to the labour force. But more importantly, the tightening in monetary policy by the Fed to bring inflation back to target should result in a more significant slowdown in growth and a rise in the unemployment rate. This would lead to a return to a more normal economic cycle.

    Semblance Of Normality To Return, But Not Quite Yet

    We expect some semblance of a normal cycle return in the coming quarters as the US economy goes into recession. Not only would GDP growth likely to be contracting, but the pick-up in the unemployment rate would first lead to the output gap shrinking, then turning negative. Inflation should also have eased from lofty levels.

    For investors, it would mean a return to more familiar territory where equities offer attractive valuation opportunities in recessions. At the same time, despite dismal corporate earnings, US stocks have typically been lifted by the re-rating in the market.

    This occurs thanks to the central bank cutting interest rates in response to the worsening growth and inflation landscape. We saw with the rally this summer how investors (prematurely) anticipated a Fed ‘pivot’ to a less restrictive policy stance in support of economic growth and its second mandate of maximum employment. This drove a powerful re-rating, which abruptly reversed when Fed chairman Jerome Powell dashed hopes of a looser near-term policy.

    He warned that the central bank would ‘keep at it’ in relation to raising interest rates.

    We do, however, expect there to be scope for a Fed pivot toward the end of next year as the policy is likely to be eased to counter the impact of a recession.

    By Tina Fong, Strategist, Schroders

  • Can A Weaker Renminbi Rescue The World From Inflation Crisis?

    Can A Weaker Renminbi Rescue The World From Inflation Crisis?

    The renminbi has depreciated by about 8% against the US dollar so far this year and, at RMB6.96 per US dollar, is already homing in on our year-end target of RMB7 per US dollar.

    China’s central bank, the People’s Bank of China (PBoC), has begun to resist further depreciation, cutting its reserve requirement by two percentage points to 6% last week and setting the daily fix for the official exchange rate at stronger-than-expected rates in recent days. But with the US dollar still surging and probable recessions in most developed markets set to weigh heavily on external demand, there is a clear risk that the exchange will overshoot to somewhere in the region of RMB 7.10-7.20 per US dollar.

    A weaker renminbi is often associated with delivering a deflationary impulse to the rest of the world. After all, as the currency depreciates, imports of Chinese goods become cheaper for the rest of the world. So has the recent depreciation of the renminbi relieved pressure on global central banks in their quest to tame inflation?

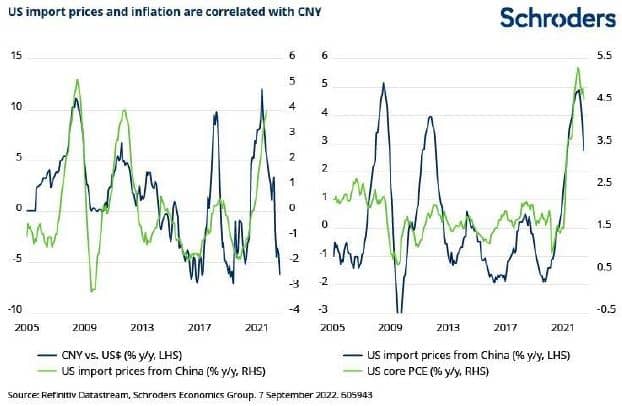
    There certainly does appear to be a link between movements in the renminbi and rates of inflation experienced by its trading partners. For example, as the charts below show, US import prices from China fluctuate with the exchange rate. And these import prices are closely correlated with core goods inflation in the US. This makes intuitive sense, and similar relationships are observed in other economies, such as the eurozone.

    However, there are a couple of reasons to doubt that renminbi depreciation has solved the global inflation crisis.

    For a start, the correlation between currency movements and prices only applies to the core goods portion of inflation in other countries.

    The renminbi has no major impact on other key drivers such as owners equivalent rent, local services or indeed international commodity prices, all of which account for the bulk of inflation in markets such as the US.

    As such, the relationship between the renminbi and headline inflation, in this instance in the US, is relatively weak, with several periods of currency volatility failing to follow through into headline inflation.

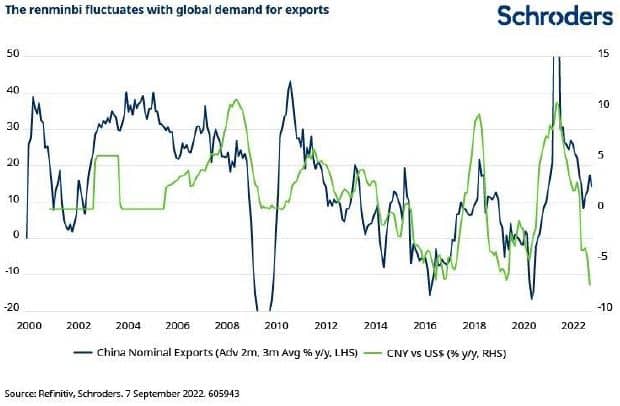
    More generally, we need to be careful about assuming that correlation means causation. After all, the renminbi tends to be very cyclical. When exports are growing strongly, the currency tends to appreciate, and when exports are coming off – as is the case now – the currency tends to depreciate. And, of course, when global demand is strong, China’s exports are performing well, and the renminbi appreciates, firms can pass on higher costs to consumers and fuel inflation.

    On this basis, global inflation dynamics are still a function of the strength of demand and movements in the renminbi are largely a by-product of its impact on trade. Indeed, an expected slowdown in exports as demand for manufactured goods softened has been a key reason for our bearish view of the renminbi since the start of the year.

    The upshot is that, barring an unlikely large one-off depreciation, the weaker renminbi neither significantly changes global inflation dynamics nor needs developed market central banks to keep raising interest rates.

    About the Author

    David Rees, Senior Emerging Markets Economist, Schroders

  • Is Malaysia Going To Go Bankrupt?

    Is Malaysia Going To Go Bankrupt?

    Lately, after Sri Lanka became bankrupt, numerous messages have been circulating on social media claiming that Malaysia will go bankrupt next.

    You might have seen them on FB, Insta, and Tik Tok or forwarded WhatsApp messages that we are doomed next.

    But do these claims hold? Let’s examine the numbers.

    How Does A Country Go Bankrupt?

    A country’s economy collapses when it has no or zero cash reserve, exports and economic activities.

    In Sri Lanka’s case, rampant corruption, economic mismanagement and meddling with the constitution by the ruling elite have led Sri Lanka to bankruptcy, affecting millions of citizens in the island nation.

    They are now facing fuel and food shortages, high inflation and endless political turmoil. Sri Lanka is now drowning in its worst-ever economic crisis and pleading for other nations’ help to keep its economy afloat.

    Following a 70% drop in foreign exchange reserves since January 2020, Sri Lanka has struggled to pay for essential imports such as food and fuel. Its foreign currency reserves fell to US$2.31 billion in February, a fall of US$779 million from December 2021 through January 2022.

    What led to these dire situations was a series of unfortunate events.

    Here Are Some YouTube Videos Which Explain The Crisis In Detail:

    Why Sri Lanka is Collapsing: the Coming Global Food Crisis

    Gravitas Plus | Explained: Sri Lankan economic crisis

    How One Powerful Family Destroyed A Country

    To summarise the videos, some key factors diagnose the health of a nation’s economy. Let’s have a look.

    Foreign Exchange Reserve

    Sri Lanka’s Foreign Exchange Reserve

    Malaysia’s Foreign Exchange Reserve

    Foreign reserves are the foreign currencies a country’s central bank holds as backup funds in an emergency, such as a rapid devaluation of its currency.

    It is good practice to hold foreign exchange reserves in a currency that is not directly connected to the country’s currency. Therefore, most reserves are held in U.S. dollars, the most traded currency in the world.

    Countries use foreign currency reserves to keep a fixed rate value of their currency, maintain competitively priced exports, remain liquid in case of crisis, pay external debts and provide confidence for investors. Therefore, an increasing foreign exchange reserve is ideal. Malaysia, in comparison to Sri Lanka, has a strong foreign reserve which has been increasing while Sri Lanka’s foreign reserve has been declining.

    Balance Of Trade

    Sri Lanka’s Balance of Trade

    Malaysia’s Balance of Trade

    Balance of trade (BOT) is measured as the difference between the value of a country’s exports and the value of a country’s imports for a given period.

    A positive trade balance (surplus) is when exports exceed imports, while a negative trade balance (deficit) is when exports are less than imports. A trade surplus does not necessarily indicate a healthy economy, nor does a trade deficit necessarily indicate a weak economy.

    While a trade surplus helps in creating employment and economic growth, it may also lead to higher prices and interest rates within an economy. When based solely on trade effects, a trade surplus means high demand for a country’s goods in the global market, which pushes the price of those goods higher and leads to a direct strengthening of the domestic currency. On the other hand, a trade deficit can be beneficial to countries that import heavily and simultaneously invest in economic development.

    Malaysia, an export nation, has a consistent trade surplus, while Sri Lanka has had a trade deficit for the past years. Unfortunately, Sri Lanka did not invest heavily in economic development activities.

    Malaysia’s Export Category

    Sri Lanka’s Export Category

    Moreover, Malaysia’s exports are varied, well diversified and highly valued, mainly contributed by the Electric and Electronics industry, Oil and Gas and palm oil. Sri Lanka’s exports, on the other hand, are highly dependent on the low-value clothing and agriculture industry, and their GDP heavily relies on tourism.

    Government Debt To GDP

    Sri Lanka’s Government Debt to GDP in Percentage

    Malaysia’s Government Debt to GDP in Percentage

    The debt-to-GDP ratio compares a country’s debt to its gross domestic product (GDP). The ratio indicates a country’s ability to pay back its debts by comparing what it owes with its production.

    The higher the debt-to-GDP ratio, the higher its risk of default and the less likely the country will pay back its debt.

    Even though Malaysia has gone through a series of economic and financial recession crises before, it has never failed to pay interest and mature debts, proving Malaysia’s reputation and capability as a debtor with a good repayment record.

    Article 98 (1) (b) of the Federal Constitution stipulates that the Government must prioritise debt charges over other operating expenses. The External Borrowing Act 1963 provides that offshore borrowings cannot exceed RM35 billion. As of the end -of June 2022, this debt amounted to RM29.4 billion.

    The Provisional Measures for Government Financing (Coronavirus Disease 2019 (COVID-19)) (Amendment) Act 2021 stipulates that the statutory limit of Government debt cannot exceed 65% of GDP. At the end of June 2022, statutory debt accounted for 60.4% of GDP.

    In addition, 97% of the Federal Government’s total debt is in the Ringgit denomination. This reflects prudent debt management as exposure to foreign exchange risk is minimal.

    Is Malaysia Going To Go Bankrupt?

    Based on Malaysia’s economy, the big answer is NO.

    However, as I explored more about the circumstance which led to the Sri Lanka crisis, I couldn’t help noticing parallels between the political and economic situation in Sri Lanka and Malaysia. The situation in Sri Lanka warns us about where we could be headed if we don’t address similar structural problems in Malaysia.

    We can avert the crisis Sri Lanka faces if we are willing to learn the lessons the island nation offers.

    The problem in Malaysia is social economics, which is stagnant. To elaborate more on social economics problems, here is the list:

    • Lack of proper economic policy and implementation of the policy
    • Lack of policies to control fake demand induced inflation, especially in the property market
    • Lack of technological innovation and skills appreciation in STEM
    • Lack of policies to ensure proper business ethics and transparencies in the business industry
    • Lack of law enforcement leading to rampant corruption
    • Lack of political stability

    Therefore, we, the Rakyat should exercise our rights by electing competent leaders at the next general elections to ensure Malaysia does not go down the path taken by Sri Lanka.

    Source: J Advisory

  • What Net Zero Means for Inflation

    What Net Zero Means for Inflation

    Inflationary pressures are likely to increase amid measures to discourage high-carbon energy sources, although much depends on how policymakers intervene to tackle global warming.

    Reducing carbon emissions is essential to curb global warming, one of the biggest long-term risks for the world economy. All countries across the globe will have to introduce ambitious mitigation policies over the next few years if the physical costs associated with a changing climate are to be limited.

    Consensus among economists on carbon taxes as an effective policy lever to tackle climate change is rapidly growing.

    By internalising the costs of the negative impact on health, the environment, and future generations, carbon taxes provide great incentives to transition to “net zero” emissions. They not only curb demand for fossil fuels, but also encourage business investment in renewable energy and low-carbon technologies, stimulating innovation.

    In addition, they represent a source of government revenue. This can be used to finance tax reforms, lowering taxes on workers and businesses while supporting economic growth, or redirected to fund investment in climate technology.

    Carbon taxes are fundamental to discourage the use of high-carbon energy sources and key to drive the behavioural change needed for the move towards net zero. They are, however, likely to have a large impact on energy and electricity prices, given the current widespread use of fossil fuels for energy production.

    What Our Three Scenarios Tell Us

    business man show increase market share, growth of profit investment

    To analyse and better understand the impact of carbon taxes on inflation, we use the Oxford Economics Global Economic Model (GEM) to consider three different scenarios: Net Zero, Net Zero Transformation (NZT) and Delayed Transition.

    Given the high degree of uncertainty around policy intervention to tackle global warming, scenario analysis is a key framework to assess the implications of climate-related risks.

    In the Net Zero and NZT scenarios, global warming is limited to around 1.5°C by 2050 as carbon taxes start from 2022.

    The Delayed Transition scenario, meanwhile, sees temperatures increase by 1.7°C as it assumes annual emissions do not decrease until 2030.

    The key difference in assumptions between the first two scenarios is that only the NZT scenario assumes that there are wider economic benefits associated with innovation. NZT also factors in a greater amount of green investment from the private sector.

    Carbon prices are lower than those in the Net Zero scenario as it is assumed that benefits from research and development bring down the marginal cost of reducing emissions.

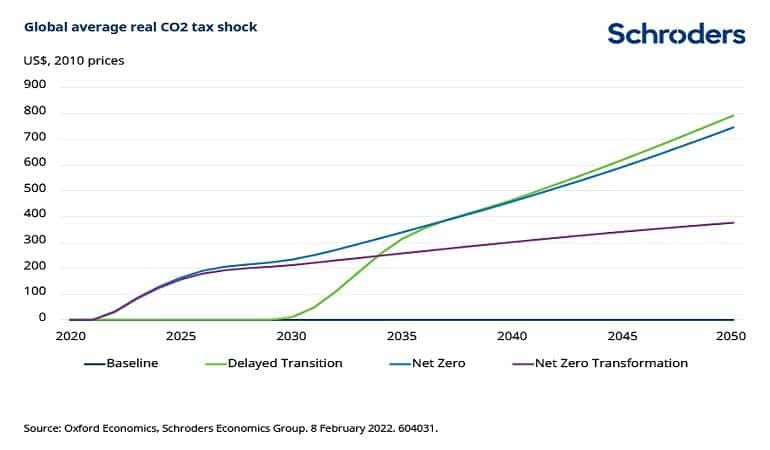
    The assumptions on carbon taxes for the different scenarios are shown in chart 1. These trajectories are consistent with the analysis done by the Network for Greening the Financial System (NGFS) that derives the carbon tax for a given degree of mitigation while maximising welfare. The Delayed Transition scenario highlights the risks associated with governments failing to act swiftly. The world ends up with more stringent policies from 2040 as a stronger price signal is needed to limit global warming. The chart also shows the economic benefits associated with greater innovation, reflected in much lower carbon taxes for the NZT scenario.

    Chart 1

    chart 1 inflation net zero schrodersCarbon prices rise to US$200 per tonne of carbon dioxide (tCO2) by 2030 and steadily increase to more than US$700/tCO2 in 2050 in the Net Zero scenario. Prices do not exceed US$400/tCO2 under NZT. In the Delayed Transition, carbon prices increase rapidly after 2030 to reach US$800/tCO2 in 2050.
    Oxford Economics assumes that the government recycles 50% of the carbon tax revenues back to consumers in the Net Zero and in the Delayed Transition scenarios. The other 50% remains on government balance sheets and is partly used to fund investment.

    In NZT, they assume that the government fully recycles revenues in the form of lump-sum transfers to households. Therefore, the clean energy transition is financed by increased government borrowing that takes the global economy on a higher equilibrium level of economic growth.

    What Will Drive Inflation?

    The impact on inflation will come via changes in energy prices. The Oxford Economics model assumes that fossil fuel supply is slow to adjust to the change in prices. In contrast, demand is more elastic, adapting more rapidly to a change in price. These are realistic assumptions.

    Therefore, spot prices fall below baseline on the back of weaker demand for fossil fuels. However, the move in the spot price is not large enough to keep the after-tax price at the pre-shock level. Given the large magnitude of the tax increase, after-tax prices are significantly higher than their baseline level.

    It is evident that oil prices will rise more rapidly in the Delayed Transition scenario starting from 2030 given the disorderly impact of the late policy implementation. Meanwhile, oil price increases are more modest in NZT thanks to the lower tax profile associated with greater innovation and green investment that boosts productivity.

    Higher Inflationary Pressures On The Horizon

    The recent developments in the gas and oil markets are already showing us how important energy prices are for headline inflation. Accelerating energy prices have been a key factor behind the recent surge in global inflation. Therefore, it should not come as a surprise that with the adoption of carbon taxes, inflationary pressures will increase globally. In addition, the move to net zero will also dramatically boost demand for key industrial metals used to generate and store renewable energy. Given the supply challenges, this is likely to add further pressure on inflation, via higher prices for aluminium, copper, cobalt and lithium.

    Carbon prices are estimated to boost US headline CPI, adding 300 basis points (bps) to our baseline forecast in the years following the implementation of the carbon tax. However, higher inflation will be temporary as pressures on prices will be mostly concentrated in the early stages of the transition.

    As countries decarbonise their energy production and move away from taxed products, inflation will start declining in the second half of 2020s, returning to its baseline level by 2050. Inflation under the NZT will return more quickly to its baseline due to higher productivity and less severe carbon pricing. Meanwhile, in Delayed Transition, inflation will start rising from 2030 and remain above the baseline in the longer term due to continued increases in taxation policy.

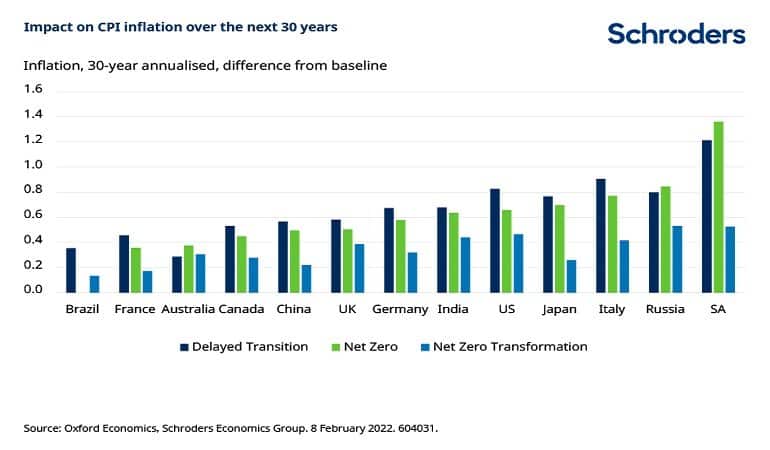
    It is important to note that the impact on price growth will not be homogeneous across countries, as shown in chart 2. Over the next 30 years Brazil and France will see the smallest inflation increases, while Russia and South Africa are likely to experience the largest rises. The UK and Germany will also be affected, with the Net Zero transition expected to add more than 50bps to headline inflation over the next 30 years. The analysis also highlights the greater risks to price pressures associated with the delayed transition on the back of more severe increases in carbon prices.

    Chart 2

    chart 2 inflation net zero schroders

    The impact of carbon pricing across the globe will depend on various country-specific factors. First of all, the magnitude of carbon taxes is a key determinant in the change in energy prices. Most developed markets will see carbon prices well above the global average. Europe will experience the highest price, almost US$900/tCO2 in 2050 in the Net Zero scenario, closely followed by the US and Japan. European prices are higher than other developed countries due to the region’s relatively smaller endowment for CO2 removal, via carbon capture storage technology, for example. Carbon prices for emerging markets will be much lower than their developed counterparts, increasing to US$600/tCO2 by 2050.

    Another key factor behind the cross-country differences of the inflationary impact is the energy mix. Countries that are currently more reliant on fossil fuels for their energy generation will be more exposed to carbon taxes, as a higher share of fossil fuels strengthens the pass-through to prices.

    The degree to which energy prices rise also strictly depends on the carbon content of the fossil fuels used. This is because coal is much more carbon intensive than oil and especially gas, implying that for the same amount of tax, coal prices will rise more than the other fossil fuels.

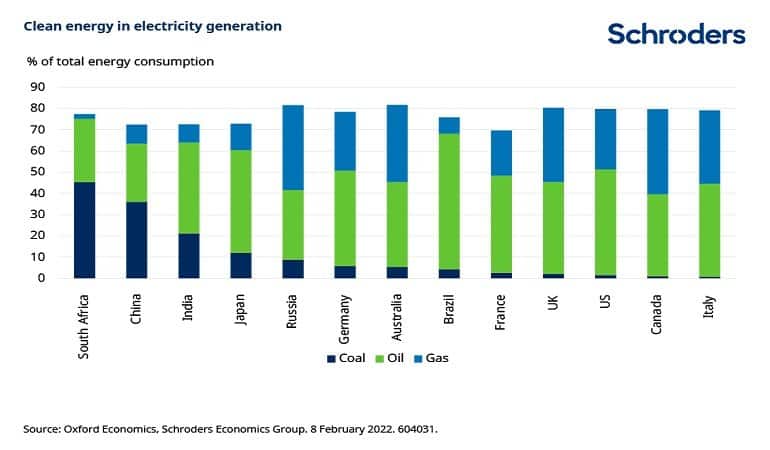
    It is therefore important not only to look at the amount of fossil fuels used in the energy production, but also at the carbon content of each source. Chart 3 highlights that emerging markets heavily rely on dirtier sources of energy. South Africa leads the way, as coal accounts for more than 60% of its energy demand, followed by China and India. Countries highly dependent on oil like Brazil, Japan, Russia and the US will also see significant increases in fuel prices.

    Chart 3

    chart 3 inflation net zero schroders

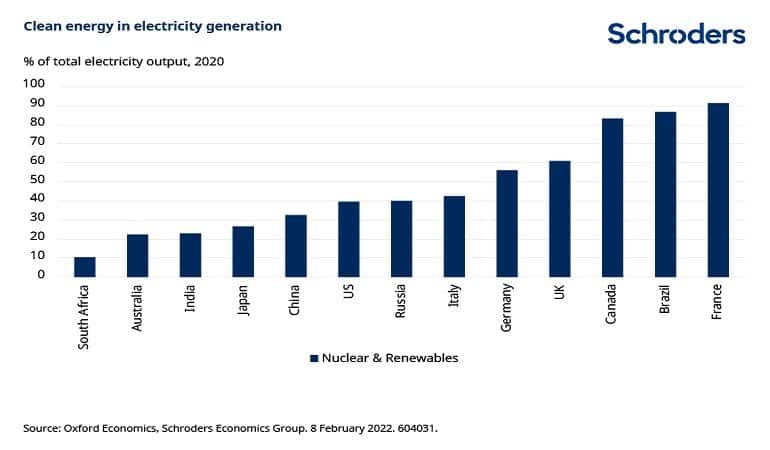
    Electricity prices will also be impacted by carbon taxes. The higher the share of renewables and nuclear used for electricity generation, the weaker the pass-through to electricity prices. Countries like France, Brazil, and Canada, whose electricity is already being produced with more than 80% of clean energy, will see a more modest rise in inflation.

    Achieving net zero emissions requires a radical decarbonisation of the energy mix. By 2050, all coal mining will need to end, stranding these assets. Moreover, the majority of oil reserves will also be unburned. This means that developed countries will need to be less dependent on these dirty sources of energy, and consume low-carbon sources, like natural gas, and rely more on nuclear and renewables. By 2050, oil is assumed to account for less than 10% of total energy consumed for most developed economies (chart 4).

    Chart 4

    chart 4 inflation net zero schroders

    What Are The Implications For Central Banks?

    Carbon taxes represent an efficient policy tool to tackle environmental problems, but it is clear that they will lead to inflationary pressures. These will be felt across the globe, but will be more pronounced for economies that still largely rely on energy from fossil fuels. It is interesting that the impact on inflation in European countries will be more limited despite them likely to see the most severe carbon taxes and highest carbon prices. This is thanks to their greater use of clean energy, especially in France.

    Our analysis also shows that inflationary pressures are mostly concentrated in the near term. The transitory nature of inflationary impact could imply that central banks look through the carbon pricing shock. The current prevailing consensus is that monetary policy should look through energy shocks as these tend to be short-lived and only result in a temporary deviation from the inflation target, provided that expectations remain anchored. And this is in line with what the Oxford Economics model assumes. But the energy transition will require a radical transformation in the energy sector, with the potential to generate large demand and supply imbalances, posing profound challenges to policymakers.

    Finally, carbon prices are likely to act as a trigger for large investment stimulus, boosting employment and aggregate demand. Higher energy prices, if associated with a smaller output gap and stronger underlying price pressure, could force central banks to abandon any “look-through policy” and act to preserve price stability.

    About the author

    Irene Lauro is an economist at Schroders.

  • Analysis: A Bright Spot for ASEAN Economies

    Analysis: A Bright Spot for ASEAN Economies

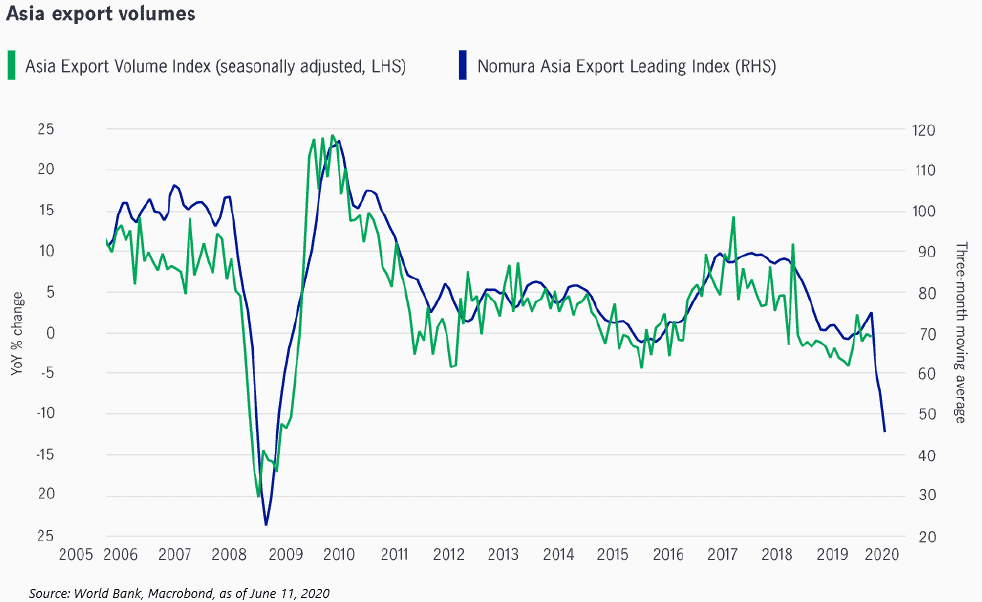
    Global trade volumes topped out in 2018 amid slowing global growth and ongoing trade tensions between the US and China. In 2020, the global pandemic has been another headwind for global trade. What about ASEAN economies?

    Nomura’s leading index of Asian exports, which aggregates the region’s exports (excluding Japan) of eight forward-looking components, and typically has a three-month lead, is signalling that aggregate export growth in the region could shrink between 10% to 20% (relative to last year) in the coming months.

    Further downside risk to global trade comes from the worsening relationship between the US and China and the potential for a reescalation in trade tensions. Understandably, this backdrop makes for a difficult environment for Southeast Asian economies – specifically, members of the Association of Southeast Asian Nations (ASEAN), a group of highly trade-dependent economies.

    That said, how the region weathered challenges in the past two years has given us some confidence in its ability to navigate the current environment.

    The News isn’t All Bad

    The Asean region has been a big beneficiary of ongoing trade tensions, the global pandemic, and China’s relatively early emergence from the Covid-19 outbreak.

    The region’s share of global trade has gone from strength to strength since 2000, with trade in electronics and integrated circuits being a major driver.

    When the US-China trade war started to escalate in early 2018, there were fears that slower global trade growth would negatively impact the trade-dependent region.

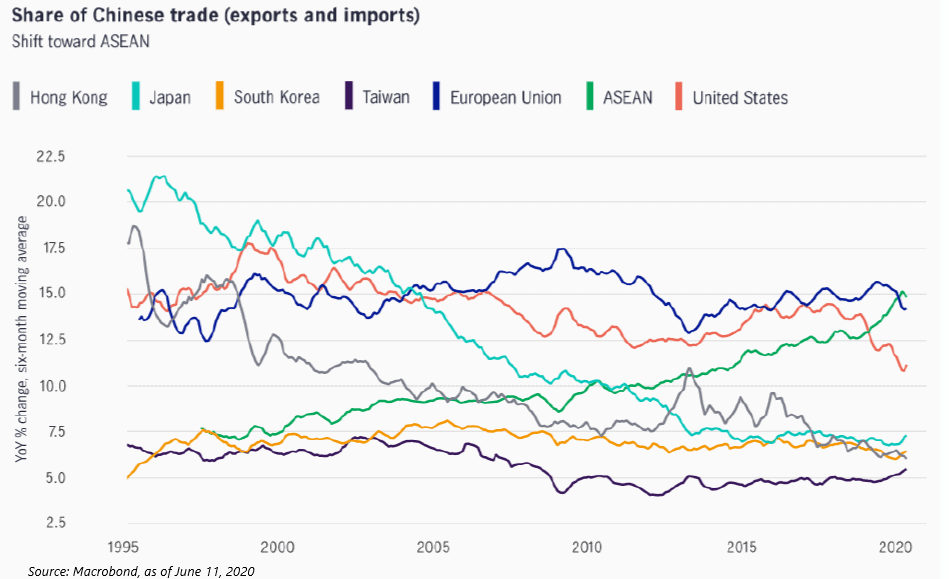
    But as events unfolded, it became clear that China looked increasingly to Asean to offset the impact of the trade war – and later, the Covid-19 outbreak – to counter the rise of increasingly stringent US trade policies.

    Asean’s share of Chinese trade (exports plus imports) overtook that of the US’ in early 2019. But it didn’t stop there – in early 2020, Asean overtook the European Union as China’s largest trading partner and its share of trade with China remains near a record high of around 15%.

    The ASEAN region has attracted many global companies that are looking to diversify their production in the wake of the US-China trade war, and the Covid-19 outbreak has accelerated that trend.

    The development is understandable – Asean sports many competitive advantages, among them, its member countries’ relatively high rankings in the World Bank’s Ease of Doing Business Index.

    The Asean-6 (namely, Indonesia, Malaysia, the Philippines, Singapore, Thailand, and Vietnam) all sit within the top half of global rankings across 10 areas of doing business – starting a business, dealing with construction permits, getting electricity, registering property, getting credit, protecting minority investors, paying taxes, trading across borders, enforcing contracts, and resolving insolvency.

    Other advantages that the region has over its competitors are: relatively lower-wage structures, better productivity, and geographic proximity to China. The fact that the region has a complementary industrial structure to China is also important.

    As China emerges from Covid-19, the gradual recovery in consumer demand in the country is being met by ASEAN. Vietnam, Malaysia, and Thailand have enjoyed particularly strong growth in demand for their goods from China.

    In our view, sectors that are likely to benefit as the Chinese economy kicks into gear include mining (benefiting major producers from Indonesia and Malaysia), semiconductor and electronics (benefiting Thailand, Malaysia, and Vietnam), and textiles and garment industries (benefiting Vietnam and Thailand).

    Important Mitigants in a Challenging Environment

    An acceleration in Asean integration in the coming years is likely to make the region even more competitive and resilient to global shocks.

    This could be achieved by reducing tariffs, improving market access, and increasing the region’s absorptive capacity further.

    The Regional Comprehensive Economic Partnership, a proposed regional free trade agreement that’s currently being negotiated, could go a long way to expand regional connectivity in trade and investment. Proponents of the agreement hope that negotiations can be concluded by the end of the year.

    On balance, even though the leading indicator for Asian export growth is warning of a major slump ahead and geopolitical risks remain elevated, there remain many positive dynamics at play that can serve as mitigants in a challenging environment.

    By Sue Trinh

    Sue Trinh is a senior macro strategist at Manulife Investment Management, a leading global asset manager, with investment expertise extending across a broad range of public and private asset classes, as well as asset allocation solutions.

  • Analysis: The World after the Flood of Fiscal Stimulus

    Analysis: The World after the Flood of Fiscal Stimulus

    The global fiscal stimulus tap has been unleashed to fight the impact of the COVID-19 outbreak. We think the impact of this stimulus is binary and, if sustained, it could break the decade-long disinflationary cycle.

    In contrast, if austerity measures are subsequently imposed, the era of low rates and low inflation will likely continue for the foreseeable future.

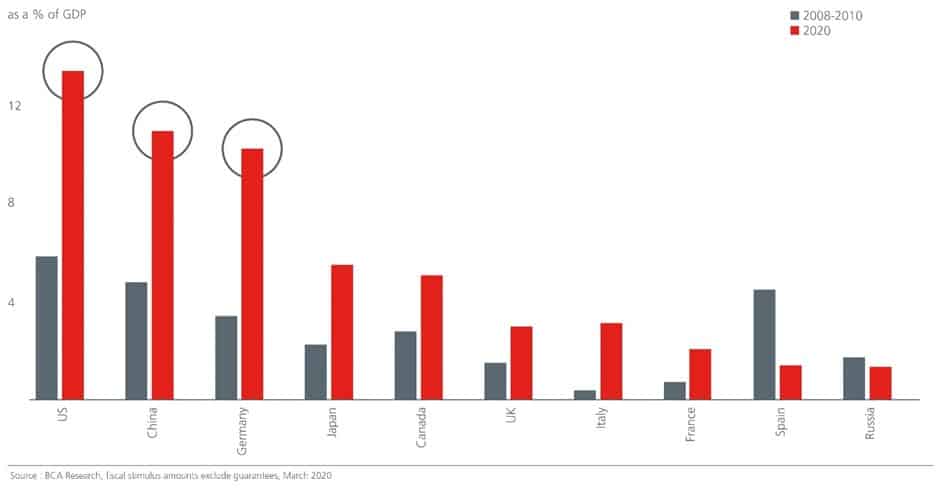
    The combined scale of fiscal and monetary response has been massive – estimated to be around US$17 trillion at the time of writing. The quantum of stimulus provided this year is also significantly higher than the 2008 Global Financial Crisis (GFC).

    This is not surprising since monetary policy has far less wiggle room now. Moreover, the pandemic is not due to bad economic decisions; there will be little backlash on governments supporting affected sectors (e.g. airlines, banks, small retailers etc.).

    Although we saw countercyclical fiscal stimulus after the GFC, it was followed by significant austerity measures as governments were worried about the inflation implications of quantitative easing (QE). But inflation never returned.

    The past decade has demonstrated the effect of loose monetary policies: negative interest rates, flatter yield curves, low inflation, accumulation of corporate debt, and narrowing credit spreads, among others. But we have little experience of knowing the combined effects of expansionary fiscal and monetary policies on economies and markets.

    Fig 1: Global fiscal stimulus exceeds 2008

    A Powerful Twin Policy-mix

    A key difference between monetary and fiscal policy is that while monetary stimulus creates a large positive liquidity shock, it requires households and companies to be willing to take on debt and spend. On the other hand, fiscal spending adds directly to aggregate demand with no private sector debt build-up.

    Large unemployment benefits and “helicopter” money are windfall gains to consumers and leave no debt behind. If the stimulus is directed towards public capital expenditure which ultimately increases economic growth and creates jobs, it would eventually crowd-in private spending and the multiplier effects would fuel higher growth.

    Recent fiscal packages have focused on mitigating the initial impact of COVID-19. When the second-round of impact hits i.e. higher unemployment, corporate defaults and bankruptcies, more fiscal support will likely be announced.

    Of course, if these stimulus packages prove to be one-off and governments hit the pause button on the deficits or actively seek to reduce it, the medium-term implications will likely mirror the conditions post GFC.

    However, if countries see renewed waves of COVID-19 outbreaks, unemployment rates may stay elevated for a number of years. Against this backdrop, and with demographics not in favour for many developed and some emerging markets, countries that have limited binding constraints will probably continue to run large deficits.

    The Fiscal Divergence

    There will likely be divergences in the impact of fiscal stimulus on developed markets (DM) and emerging markets (EM). DM economies that have the benefit of low rates, low external debt, and low inflation can afford to keep monetary and fiscal policy easy, facilitating the cycle of higher demand, higher inflation and steeper curves.

    But not all DM economies are in the sweet spot, particularly within Europe where monetary and fiscal policy do not work in tandem; certain countries may only be able to announce stimulus with constraints.

    However, within EM economies, there are potentially two groups – one which does little fiscal stimulus to start with given their prudent approach, and one that continues with fiscal stimulus despite weak external balance sheets and therefore potentially face vulnerabilities in their foreign exchange and bond markets.

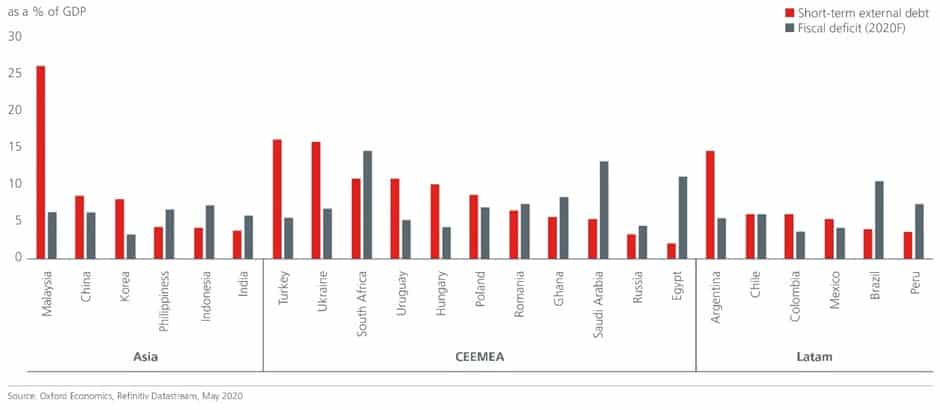
    Looking at the EMBI universe, CEEMEA (Central & Eastern Europe, Middle East and Africa) countries stand out as being the most vulnerable as they have higher short-term external debts and are expected to run large fiscal deficits this year.

    These economies indulging in fiscal extravagance may face sovereign rating downgrades, spike in bond yields, and steeper yield curves, and eventually be forced to undertake austerity measures. EM Asian economies appear as relatively stronger, with most having short-term external debts lower than 10% of GDP, with the exception of Malaysia.

    While rising fiscal deficits are bringing debt sustainability questions to the fore, it is important to highlight that debt issuances are a problem mainly when interest rates are higher than nominal GDP growth. If interest rates remain low (as they are now) and fiscal spending leads to higher growth, then debt/GDP ratios might fall or at least remain steady.

    Fig 2: EM Asia appears to be better placed

    Inflation or Disinflation?

    Sustained fiscal deficit, combined with synchronised monetary stimulus may eventually break the decade-long disinflationary trend. Adding to this tailwind to inflation is the potential negative supply side shock driven by the end of globalisation and the reversal of supply chain efficiencies.

    This scenario can be thought of as being akin to the post World War II period; after the negative demand shock and low inflation, the US economy saw a sharp rise in inflation led by stimulus, eventually forcing monetary policy to tighten substantially.

    The process may be more gradual this time; it will take a while for the current economic slack to narrow. Besides, structural changes such as more remote working and less demand for business travel and commercial real estate will likely dampen inflationary pressures.

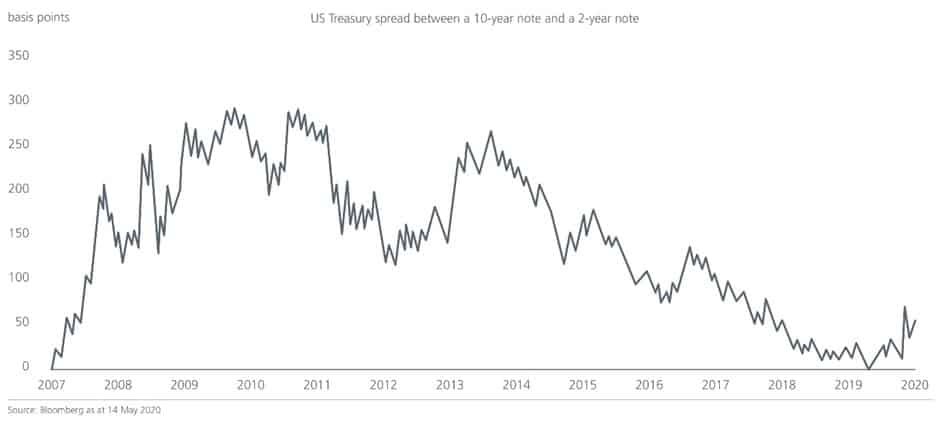
    There are several market trends that have relied on subdued inflation expectations. First would be the impact on the yield curve. Post GFC, the yield curve steepened significantly as fiscal policy eased, but reversed as soon as austerity measures kicked in. Yields have fallen substantially since and yield curves flattened as inflation expectations have plummeted and monetary policy has remained easy.

    Fig 3: Yields have declined substantially since GFC

    However, this trend may reverse – a spike in US treasury yields and a steeper yield curve is possible if the fiscal stimulus sustains. This in turn would have positive repercussions on rate-sensitive equities, particularly financials and other ‘value’ sectors.

    Binary Outcomes

    The risk of higher interest rates also implies that policymakers need to strike the right balance. Too swift a rise in yields could increase the debt burden and complicate refinancing issues for governments. Equally, rising inflation with no change in nominal rates could impede central bank credibility.

    Central bankers over the past few decades have allowed market participants to price in appropriate risks and maintained stability in bond markets, in particular.

    However, if central bank actions begin to differ from their stated objectives due to other interests, market participants will find it difficult to accurately price in various scenarios, leading to lower market confidence, higher market volatility and hinder price transparency.

    But in today’s situation, central banks may be forced to maintain accommodative policies for longer periods to maintain the solvency and liquidity of the government, keeping front-end rates well anchored.

    If this were the case despite rising inflation, real rates would decline even further, and wealth transfer would take place from savers to borrowers. From an asset allocation perspective, this would imply greater weight on equity over bonds in portfolios in order to meet stated investment objectives.

    In our view, the unprecedented fiscal stimulus we have seen post-COVID-19 can lead to binary outcomes. If the deficits sustain, the world will evolve more akin to post-World War II with higher demand, higher inflation expectations, and steeper yield curves.

    Alternatively, if governments are forced to impose austerity measures once demand returns to normal, as with post-GFC, then the era of low rates and low inflation will continue for the foreseeable future.

    By Nupur Gupta

    Nupur Gupta is multi-asset portfolio manager Eastspring Investments, Singapore. Part of Prudential plc, Easpspring Investments is a global asset manager with Asia at its core, offering innovative investment solutions to meet the financial needs of clients.

  • Analysis: Digital Banking in Malaysia

    Analysis: Digital Banking in Malaysia

    According to KPMG’s latest report entitled , in a post-COVID-19 world, the financial services sector will be a key driver of economic recovery and growth. In particular, the stage is set for digital banking to thrive.

    KPMG Malaysia Head of Financial Services Adrian Lee observed how the changing socio-economic landscape has altered customers’ money management and spending patterns as well as the way businesses are run. For both individuals and businesses, mode of payments and channels of financial management will also change.

    “Recent customer behaviours in both retail and commercial sectors during the pandemic have evolved in support of digital banking services. As customers and businesses seek alternatives to safely run operations, the potential is great for digital banking to be the next success story for the financial services sector in Malaysia,” he said.

    “Digital banking presents a value proposition poised to help companies and individuals get back into the economic saddle, and financial services providers that design its products around customer needs will stand out the most,” added Lee.

    Bank Negara Malaysia (BNM) is due to announce its application guidance for the five digital banking licences following a public consultation of the updated exposure draft on the licensing framework for digital banks, which is due to conclude on 30 June 2020.

    Interests have already been stirring among the bank and non-bank institutions, ranging from credit businesses, telecommunications, e-commerce platforms, advanced technology companies and local conglomerates.

    Lee continued, “It is widely anticipated that BNM will see a large number of applicants for the five digital bank licenses in Malaysia due to the lower entry requirements in minimum capital and significant market opportunities locally and in the region.

    “Given the emphasis BNM has placed on financial inclusion, the successful applicants will be the ones that demonstrate how their products and services will help the underserved and unserved segments rebuild themselves financially.”

    According to KPMG’s Financial Services Advisory Partner and Head of Financial Risk Management Yeoh Xin Yi, a successful digital bank should incorporate three areas into its strategic blueprint:

    Understand customer behaviours and expectations

    KPMG in Malaysia conducted an online survey to understand customer appetite and concerns when it comes to digital banking.

    The study revealed that 77% of the 1,220 respondents in Malaysia believe digital banking is the next evolution in financial services, and 82% are already using internet banking functions of their banking service providers. It is interesting to note that 82% indicated they would consider opening a bank account through online platforms only if they were regulated by BNM.

    The survey also highlighted that 79% expressed interest in better accessibility to financing products, where 52% of respondents prefer to perform online application for these financing services.

    With the conditioning of using mobile or internet services during the MCO period, it is expected that familiarity with online registrations and onboarding will increase. KPMG’s survey also indicates that consumers are most concerned about cyber security and convenience of information uploading, hence this is one area that digital banks need to pay attention to when designing a good customer experience for users.

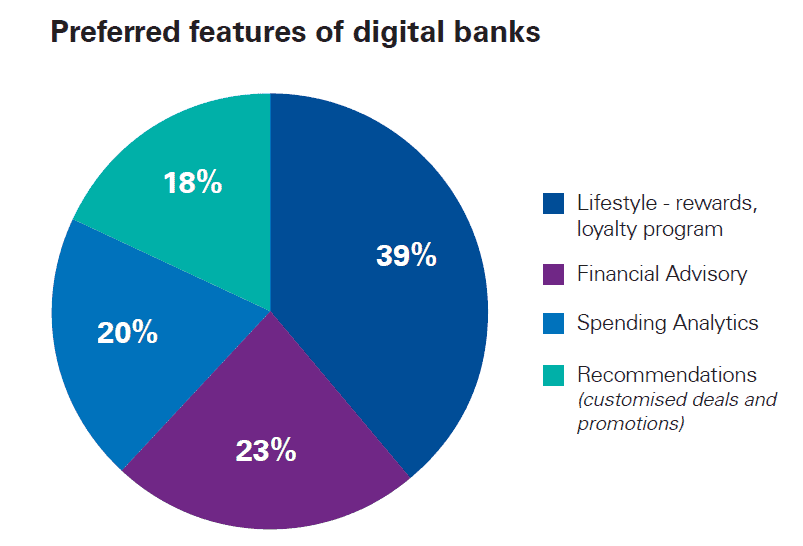
    On preferred features of digital banks, respondents appear to look forward to products and services that add value to their lifestyle (see chart below).

    Source: Survey on digital/virtual banking in Malaysia by KPMG Management & Risk Consulting, conducted from September 2019 to February 2020, involving 1,220 respondents in Malaysia.

    “Malaysian consumers are clearly ready and willing to embrace digital banking. It is up to the players to make the crucial step in establishing a customer-first model for digital banking,” said Yeoh.

    Banks, she continued, need to incorporate advanced analytics into understanding customer preferences and behaviour, from a historical as well as a forward-looking point of view. Information and data are key to providing customers with better products and services, thereby translating to economic value for the digital bank.

    Improve financial literacy and inclusion
    Despite there being more than 1,823 bank branches in Malaysia as of December 2019  and more than 37 banking institutions covering commercial banks, Islamic banks, and development financial institutions, there is still a lack of coverage for the unserved and underserved segments of the B40 and M40 groups.

    Yeoh commented, “Customers that fall into the unserved or underserved segments are more likely than others to have a profile that fall short of the conventional bank’s credit criteria when financing is sought.

    “Digital banks can view this as an opportunity to expand its reach into untapped markets while also delivering on BNM’s aspirations for financial literacy and inclusion. Ideally, we would seek to have customers achieve higher financial literacy through the provider’s ability to advise, recommend and encourage positive financial behavior.”

    For the unserved or underserved in retail and non-retail segments, micro-savings or deposits, micro-financing and micro-insurance are some of the basic products that is needed.

    These “bite-sized” products enable consumers to access affordable financial enabling services in manageable quantum, and introduces those who are financially unaware to products that can gradually improve their financial literacy and economic livelihood.

    The unserved and underserved of the B40 groups in Malaysia should be onboarded to financial service platforms that can help in cashflow management, enabling micro-savings or deposits, micro-insurance that safeguards their basic needs, and basic financing products to tide them over their financial trouble if the need arises.

    The underserved M40 and T20 segment can also benefit from the convenience and value add that digital banks can offer from a lifestyle and advisory perspective, with a different set of customized targets to help achieve their financial needs.

    Be an active platform
    Digital banks should be an active platform in the economic lifecycle of the segments it serves. It can do so by forming an eco-system or be part of an eco-system that is relevant to their users, where the user will be immediately plugged into a host of services within the digital bank platform.

    Yeoh explained, “For a micro-enterprise, for example, the platform would enable receiving payments digitally, purchasing materials via a marketplace, micro-savings and micro deposit auto functions, analytics for its business and personal finance, and basic micro-financing that commensurate with their financial behaviour and capacity as a micro-enterprise.”

    In conclusion, by leveraging on advanced technology, digital banks can fill the void that is within our economic environment and address the pain points of the unserved and underserved in both retail and non-retail segments.

  • Analysis: Property Market Expected to Bounce Back

    Analysis: Property Market Expected to Bounce Back

    As the nation endures its third week under the extended Movement Control Order (MCO), Malaysians from every walk of life face increasing uncertainty in the face of unprecedented sociopolitical and economic change.

    The impact of the MCO amid the ongoing Covid-19 outbreak on the Malaysian economy has yet to be fully realised. Conservative estimates forecast Gross Domestic Product (GDP) growth of 2.0% to 2.5% for 2020, while other analysts foresee domestic and global recession.

    However, PropertyGuru Malaysia, in line with its commitment to being the nation’s property advisor, anticipates corresponding effects on home seeker sentiment to be short-lived,with prospects for recovery in the near term.

    Bread-and-butter Issues Take Centre Stage 

    “Income and employment have been adversely affected by the closure of non-essential businesses during the MCO, and many Malaysians are prioritising bread-and-butter issues,” says Sheldon Fernandez, Country Manager, PropertyGuru Malaysia.

    Sheldon Fernandez

    “This dampened sentiment is likely to persist through to H2 2020, though measures such as the government’s Economic Stimulus Package (ESP) announcements and Bank Negara Malaysia’s (BNM’S) six-month moratorium on financing payments are laying the foundation for the market to bounce back.”

    Sentiment among home seekers was already in decline at the start of the year, with the PropertyGuru Malaysia Consumer Sentiment Study H1 2020 reporting a drop in the Property Sentiment Index to 42 points, down from 44 points in the corresponding period last year.

    This will likely see a fall in home loan applications, despite catalysts such as BNM’s recent revision of its Overnight Policy Rate (OPR) to 2.50%. Other markets experiencing Covid-19 outbreaks have seen mortgage applications drop by as much as 30%.

    Beyond these short-term impacts, research by property data analytics and solutions provider MyProperty Data Sdn Bhd underscores the property market’s resilience in the face of prior economic downturns and viral outbreaks, notably the severe acute respiratory syndrome (SARS) epidemic of 2002.

    The Resilience of Property

    While recent events have brought industries such as tourism and hospitality to a standstill, property transaction volumes and values have remained strong throughout periods of uncertainty (see Chart A).


    Chart A: Property Transaction Volume vs Value Growth (Source: MyProperty Data, NAPIC data)

    “The 1998 recession, in conjunction with the outbreak of the Nipah virus, saw volumes and values declining by 32.3% and 47.6% respectively, the largest downturn in recent decades,” says Fernandez.

    “However, the industry still moved forward, with 186,000 transactions worth RM27.9 bil. In addition, house prices as a whole have only continued to grow over the past few decades, highlighting the merits of property as an asset class.”

    According to the National Property Information Centre (NAPIC), the national house price index has not exhibited an overall decline since 1999, though its growth moderated to a low of 1.1% in 2001.

    In terms of property types, high rises exhibited the most volatility in prices from 1999-2009, from a high of 15.1% growth in 2003 to a low of –5.9% the previous year (see Chart B).

    Chart B: Malaysian House Price Index Growth (2000-2009) (Source: PropertyGuru Analytics, NAPIC data)

    From 2009 to 2018, this volatility spread to other property classes such as detached and semi-detached homes. Since 1999, terrace homes have shown the most stability and consistent price growth among property types, with prices in the segment growing by 6.5% in 2018 (see Chart C).

    Chart C: Malaysian House Price Index Growth (2010-2018) (Source: PropertyGuru Analytics, NAPIC data)

    As such, terrace homes will likely be a key focus for property seekers moving forward. This is supported by the PropertyGuru Malaysia Consumer Sentiment Study H1 2020 report, which found that terrace homes are the residence of choice (39%) among Malaysians.

    Locational Variations in Demand

    The aforementioned price trends were seen in the market as a whole, with variations in demand by area. For instance, MyProperty Data research shows that terrace homes emerged as the clear favourite in Greater Klang Valley from 1999 to 2004, in terms of transaction volumes.

    However, Kuala Lumpur saw high demand in luxury condominiums and service apartments throughout these crisis years. High-rise properties were also popular in Penang, particularly lower-end apartments and flats.

    “For Selangor, it was the city fringe, with terrace houses in Subang Jaya, USJ and Putra Heights as the hottest market. Median prices went from about RM220,000 in 1999 to up to RM400,000 by 2004. Around which time, demand similarly progressed to Setia Alam, Klang and other outlying areas towards 2012,” says Joe Hock Thor, CEO, MyProperty Data.

    Joe Hock Thor

    “Developers such as Sime Darby, SP Setia, Gamuda Land and IOI caught the wave perfectly, building larger homes within master planned townships at prices found closer to the city. High-rise popularity in Kuala Lumpur over this period picked up post-2003; this may have been due to cashed-up investors taking the opportunity to pick up glossy headline properties at discount prices.”

    This resulted in substantial price appreciation, with median high-rise prices rising from RM350,000 in 4Q 2003 to RM765,000 in 4Q 2009.

    Inflection Point and Recovery

    Whether in terms of price, transaction volume or value, the property market has repeatedly showcased a tendency to bounce back immediately following a downturn.

    This is seen in surging transaction volumes and values in the years following 1998 (the Asian financial crisis and Nipah virus outbreak), 2002 (the SARS outbreak) and 2008 (the global financial crisis and H1N1 outbreak).

    Similar recoveries are seen in national house price growth in the years following 2001, 2006 and 2009. “Price growth, as well as transaction volumes and values, have slowed down in recent years, with measures in place to address the residential overhang. This may cushion potential impacts on the market as it rolls with the blow,” says Fernandez.

    “Moving forward, investors tend to restructure their portfolios in uncertain times to manage risk, with property as a potentially lucrative venture. This, along with natural corrective forces as the market regains equilibrium, may account for the sharp recoveries seen in domestic property following crisis years.”

    These patterns are set to repeat themselves following the MCO and Covid-19 outbreak, with various initiatives contributing towards significant domestic liquidity moving forward.

    These include BNM’s reduction of the Statutory Reserve Requirement Ratio to 3.00%, moratorium on financing payments, OPR revision as well as revised voluntary EPF contribution guidelines in the government’s earlier ESP announcement.

    “For those struggling to make ends meet, these measures help address costs of living while presenting an opportunity to rebuild savings. For those with leverage, it may be a good time to invest,” says Fernandez.

    “There have already been calls from some quarters for revised loan-to-value ratio caps for third home purchases. This would accommodate demand from property seekers with leverage, driven by developer initiatives to add value for purchasers amid the changing property landscape.”

    GuruCares Reaches Out to Property Agents

    The Covid-19 outbreak and MCO have highlighted existing structural weaknesses in domestic businesses when it comes to technology-driven remote operations. However, while property players are tapping further into online platforms to drive sales, the underlying business model is likely to remain.

    “Developers have already invested in virtual show units and the online paradigm, and these can be useful for informational purposes. Due to the large emotional and financial investment required for property purchases, though, there will always be a need for the human touch, as well as physical showrooms and site visits,” says Fernandez.

    However, PropertyGuru acknowledges the potential impact of the MCO and other recent events on industry stakeholders, particularly property agents, who are often overlooked amid the larger national housing agenda.

    In its role as Asia’s largest property technology company, PropertyGuru has announced the launch of a (), aimed at easing the burden on agent partners. These include:

    • 100 free advertising credits, valid for a 12-month period to support listing activities
    • Complimentary account upgrades for renewing agents
    • 40% price reductions for any agent package, for first-time applicants, and
    • Four months’ unlimited access to Property Transaction Reports.