Category: Stocks

  • SC Unveils Measures to Support Businesses

    The Securities Commission Malaysia (SC) today announced further reliefs for public-listed companies impacted by the COVID-19 fallout. It is also considering further measures to facilitate greater access to support businesses such as funding for small and midcap companies, as well as micro, small and medium enterprises (MSMEs).

    “With this Covid-19 pandemic, we are confronting a situation that none of us has experienced in our lifetimes. It requires measured responses that consider the longer-term impact on our market and its participants, beyond this immediate crisis,” said SC chairman Datuk Syed Zaid Albar at a virtual media conference to release its annual report for 2019.

    “While the world comes together to combat this public health emergency, we have taken proactive measures to ensure that markets continue to operate in an orderly manner, as access to funding is vital to maintain confidence and ensure the long-term recovery of the market,” he added.

             SC chairman Datuk Syed Zaid Albar

    Acknowledging that companies may face challenges as a result of the pandemic, the SC also announced that Bursa Malaysia will provide affected companies listed on the Main Market temporary relief from the Practice Note 17 nn (PN17) classification in relation to the following criteria:

    1. The shareholders’ equity of the listed issuer on a consolidated basis is 25% or less of the share capital (excluding treasury shares) of the listed issuer and such shareholders’ equity is less than RM40 mil.
    2. The auditors have highlighted a material uncertainty related to going concern or expressed a qualification on the listed issuer’s ability to continue as a going concern in the listed issuer’s latest audited financial statements and the shareholders’ equity of the listed issuer on a consolidated basis is 50% or less of share capital (excluding treasury shares) of the listed issuer.
    3. A default in payment by a listed issuer, its major subsidiary or major associated company, as the case may be, as announced by a listed issuer pursuant to paragraph 9.19A of the Listing Requirements and the listed issuer is unable to provide a solvency declaration to the Exchange.

    These measures will allow companies more time to regularise their financial positions. Similar temporary relief from Guidance Note 3 classification will also be provided by Bursa for companies listed on the ACE Market. The period for this PN17 relaxation will be effective from 17 April until 30 June 2021.

    Measures for Alternative Financing Platforms

    Observing heightened interests by MSMEs to tap into alternative fundraising channels, the SC also lifted fundraising limits on Equity Crowdfunding (ECF) platforms, and allowed ECF and peer-to-peer financing (P2P) platforms to operationalise secondary trading, both with immediate effect.

    From now till 30 September 2020, the government co-investment fund MyCIF, administered by the SC, has also increased its funding matching ratio from 1:4 to 1:2 for eligible ECF and P2P campaigns, to provide additional liquidity into the alternative fundraising space.

    The SC also called upon the industry to seize the opportunity to accelerate their digitisation transformations and offer more online products and services to investors as the regulator observed a significant increase of new online trading accounts opening in recent months.

    The SC itself, in view of this new norm, will expedite guidelines for holding virtual general meetings and facilitate alternatives to meet take-over requirements.

    The regulator is also working on efforts to broaden the suite of product offerings of fund management industry through facilitating the introduction of waqf-based collective investment schemes and alternative investments for wholesale funds, where underlying assets can be property, gold or private equity.

    Noting that extraordinary times call for extraordinary responses, Syed Zaid said this is not business as usual and the SC is deploying a wide range of regulatory tools to provide support to the market and relief to market participants.

    Protecting Investor Interest

    While the regulator is doing what it can to support the businesses, Syed Zaid said the SC remains steadfast in ensuring investor interest is protected during this challenging time. “We continue to raise investor awareness on scams, as scammers tend to target people during times of uncertainty.

    The SC will take a targeted approach to protect vulnerable investors and minority shareholders. I would also like to remind our intermediaries to remain vigilant and for PLCs to remember their obligations to shareholders and to make timely disclosures,” he stressed.

    The SC also assured investors that the Malaysian capital market remains fundamentally strong and is functioning in an orderly manner, supported by deep domestic liquidity, complemented by the government’s stimulus packages, amidst non-resident outflows.

    “Over the years, Malaysia has withstood many crises and the SC has worked closely with the industry to strengthen the capital markets and addressed systemic weaknesses. As a result, the Malaysian players and institutions are better equipped to face the onslaught of challenges arising from this pandemic,” added Syed Zaid.

    As the financial system adjusts to the impact of Covid-19, the SC will continue to monitor the evolving situation in global and domestic markets, and calibrate its responses and update the public accordingly.

    Segments of Bond Issuers under Stress

    Corporate bond issuers in the aviation, oil & gas (O&G) as well as trading and services segments are experiencing short-term financial stress that may result in higher risks to their credit positions.

    While that could weaken their credit positions it would not necessarily result in defaults as the majority of issuers are in the triple A and double A rating categories, said Kamarudin Hashim, SC executive director, of Market and Corporate Supervision, during the same media conference.

    “And in the event of credit deterioration, there should be should be sufficient buffers before cash flow becomes severely constrained.”

    In addition, he said several of these issuers within these segments have some form of support in the form of financial guarantees or corporate guarantees.

    He pointed out that defaults rates in the corporate bond markets have declined significantly since the Asian financial crisis. “At that time it was around 9.4% and has come down to below 1% up to last year,” said Kamarudin when answering a question from the media on the possibility of defaults by issuers of corporate bonds, sukuks and P2P (peer-to-peer financing) notes.

    “Moving forward and due to uncertainties arising from the Covid-19 pandemic as well as the slower global growth, there are several issuer segments that may see higher risks to their credit positions.

    “The areas include aviation, oil & gas as well as trading and services. These are segments under stress currently, and they represent around 8% of the total corporate bonds issuances,” he added.

    He said a prolonged weakening of issuers’ cash flow will be a cause of concern and the SC will continue to monitor this space.

    “As investors in the corporate bond market are also predominantly institutional investors, in the event of default they will be able to pursue various options to preserve their investments through negotiations such as rescheduling or restructuring, or rigorously pursuing their contractual rights and priority of claims against the issuer.”

    In relation to P2P financing, he said the average default rate remains similar to last year at around the 4% mark.

    “At the moment, the SC is not considering imposing a blanket moratorium on P2P financing notes. Our approach is for issuers to work together with [P2P financing platform] operators if they are under stress for possible restructuring and rescheduling,” he added.

    By Lee Min Keong

    For more information on the SC’s measures to maintain market integrity, please visit www.sc.com.my/covid-19 and www.sc.com.my/resources/publications-and-research/sc-ar2019

  • Malaysian Capital Market Continues to Finance Economy

    Malaysian Capital Market Continues to Finance Economy

    The domestic capital market continued to play an important role in financing the Malaysian economy during 2019, says the Securities Commission Malaysia (SC).

    The total size of the capital market expanded to RM3.2 trillion in 2019 from RM3.1 trillion the year before, with debt securities outstanding and equity market capitalisation of RM1.5 trillion and RM1.7 trillion respectively (2018: RM1.4 trillion and RM1.7 trillion respectively), according to the SC Annual Report 2019.

    Notwithstanding the challenging global backdrop and ongoing domestic policy reforms, the Malaysian capital market witnessed a higher level of fundraising activities during the year, with total funds raised in the bond and equity market amounting to RM139.4 bil in 2019 compared to RM114.6 bil in 2018.

    Alternative fundraising avenues have also continued to gain traction, especially in equity crowdfunding (ECF)  and peer-to-peer (P2P) financing, with total funds raised more than doubled to RM443.8 mil (2018: RM195.9 mi).

    A total of RM132.8 bil was raised in the corporate bond and sukuk market compared to RM105.4 bil in 2018, with issuances mainly in utilities and financial services. Sukuk made up 77.1% of total bond issuances in 2019.

    Meanwhile, RM6.6 bil was raised via the equity market (2018: RM9.2 bil), of which RM2 bil was through new equity listings with a total of 30 IPOs and RM4.6 bil raised via secondary fundraising. In 2019, four companies were listed on the Main Market, 11 companies on the ACE Market, and the remaining on the LEAP Market.

    Notably, the size of issuances via the LEAP Market grew by 60.6% y-o-y to RM92.2 mil in 2019 (2018: RM57.4 mil). In the fund management industry, total assets under management (AUM) rose to RM823.2 bil (2018: RM743.6 bil) amidst an increase in market value, driven by robust performance of small and mid-cap equities and higher net injection from dividend reinvestment.

    Total net sales for the unit trust segment amounted to RM30.5 bil in 2019, a decrease of 19.5% y-o-y (2018: RM37.9 bil). In terms of portfolio flows, total non-resident inflows amounted to RM8.7 bil in 2019 (2018: portfolio outflows of -RM33.6 bil), mirroring regional trends.

    The bond market recorded total inflows of RM19.9 bil (2018: outflows of -RM21.9 bil) while the equity market recorded total outflows of -RM11.1 bil (2018: outflows of -RM11.7 bil). In the bond market, non-residents accounted for 13.7% of total outstanding ringgit bonds as at end December (end-2018: 13.1%) – most of which were Malaysian Government Securities (MGS) at 80.1% of total foreign holdings (end-2018: 79.1%).

    Orderly Market Adjustments of Fund Flows

    In the equity market, foreign holdings remained stable at 22.4% of total market capitalisation in 2019, in line with its five-year average. The high level of domestic liquidity in the capital market continued to allow for orderly market adjustments of fund flows between non-residents and local investors.

    The Malaysian bond market grew 7.1% from RM1.4 trillion in 2018 to RM1.5 trillion as at end 2019. This was supported by higher levels of debt fundraising, sustained demand by domestic institutional investors, and favourable domestic macroeconomic conditions.

    Despite the challenging environment, Malaysia was also among the emerging East Asian economies that saw local currency bond markets expand in 2019. In 2019, as a percentage of GDP, Malaysia remained the third largest local currency bond market in Asia after Japan and South Korea.

    However, ongoing trade tensions, the shift in global monetary policy expectations, and general concern over slower global growth continued to drive volatility in the bond market throughout the year. MGS yields experienced downward pressure across tenures, tracking global trends, on the back of major central banks’ shift in monetary policy stance and overall higher global risk aversion.

    It also reflected the lower domestic growth and inflation expectations alongside the Overnight Policy Rate (OPR) cut by Bank Negara Malaysia (BNM) in May 2019. As such, yields reduced across the board while the overall curve was relatively flatter for the year.

    Double-digit Growth for Mid- and Small-caps

    For the Malaysian equity market, overall market capitalisation ended the year marginally higher by 0.7% to RM1.71 trillion in 2019 from RM1.70 trillion in 2018. This was despite the challenging external environment with heightened headwinds mainly from the ongoing US-China trade tensions and weaker global growth.

    Overall, while the FBMKLCI moderated in 2019, some segments in the broader domestic equity market gained significant traction, partly reflecting a shift in investors’ preferences. This occurred as sentiments swayed in favour of constituents with better valuation and corporate earnings prospects, particularly in the small and mid-cap segments.

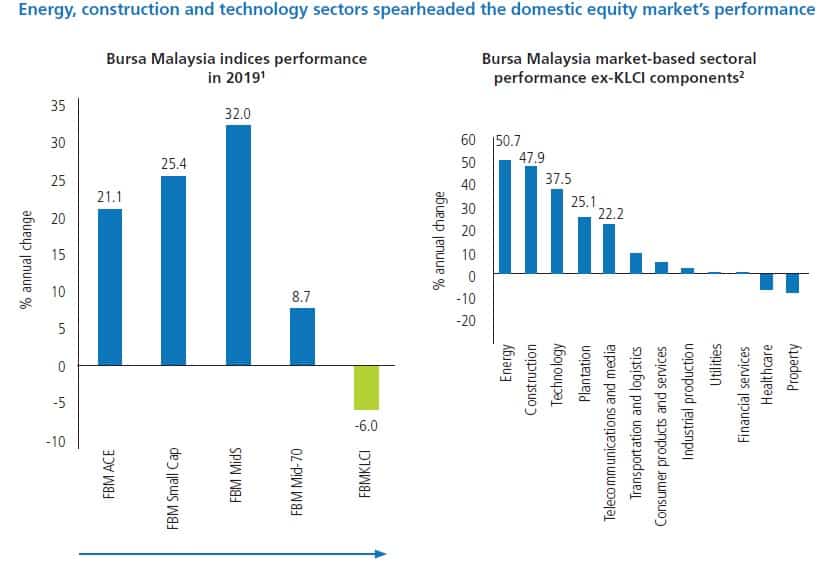
    The FBMKLCI declined by 6% y-o-y to close the year at 1,588.76 points (2018: -5.9% y-o-y to 1,690.58 points), influenced by a year of event-driven volatility in sentiments as well as subdued corporate earnings, which continued to be a pressure point on the benchmark index.

    Additionally, the FBMKLCI was also weighed down by major counters subjected to key policy adjustments in 2019, aimed at longer-term improvement.

    Nevertheless, the non-FBMKLCI components in the Malaysian equity market performed favourably in 2019. It registered higher growth despite the challenging external headwinds, as improved earnings outlook garnered investor interest into this segment.

    The FBM MidS, FBM Small Cap and FBM ACE indices increased at robust double-digit rates of 32% y-o-y, 25.4% y-o-y, and 21.1% y-o-y respectively in 2019.

    The significant growth in small and mid-cap indices was mainly driven by the energy, construction, and technology sectors, which benefitted from stronger fundamentals and better valuation prospects of their key companies during the year.
    Excluding the FBMKLCI components, the energy sector specifically recorded the largest increase, rising by 50.7% y-o-y (2018: -17.3% y-o-y4), while the construction sector increased by 47.9% y-o-y (2018: -46.0% y-o-y), owing partly to the revival of public projects by the government.

    The technology sector, in turn, rose by 37.5% y-o-y (2018: -9.32% y-o-y), benefitting from the 5G network rollout, higher global smartphone shipments, and potential trade diversion stemming from the ongoing US-China trade war.

    Robust Fund Management Industry

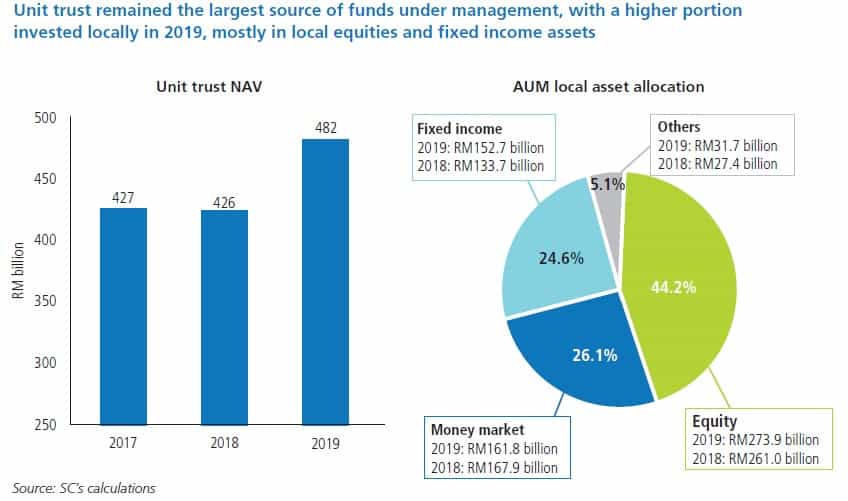
    Meanwhile, in the fund management industry, the unit trust segment remained the largest source of funds towards the AUM, with net asset value (NAV) amounting to RM482.1 bil in 2019 (2018: RM426.2 bil).

    Overall, 75.3% of the fund management industry’s AUM was invested locally, of which 44.2% was in domestic equities, followed by 26.1% in money market placements, and 24.6% in fixed income.

    Compared to 2018, investment in local equities and fixed income rose in value by RM12.9 bil and RM19 bil respectively, while the domestic money market placements decreased by RM6.1 bil.

  • How-To: Stock Valuation Strategies

    How-To: Stock Valuation Strategies

    Are you a value investor?

    Value investor

    Value investing motto is buying what’s undervalue in the market and then make money from it  when the price goes up in a long run. As such, stock valuation strategies will have a great impact on investment returns.

    Alex Bryan Morningstar

    Learn Smart Way of Investment Stock Valuation Strategies from Mr. Alex Bryan, CFA, the director of passive fund research with Morningstar.

    Valuations aren’t great for timing investments

    Stock Valuations are helpful for gauging expected returns, so it wouldn’t be wise to completely ignore them. However, valuations don’t appear to be very helpful for tactical adjustments across regions, sectors, and factors, or for timing exposure to credit risk. If valuations are unusually high, future returns will likely be lower than normal, and vice versa.

    Valuations are only a moderate predictor of performance

    Based on a study, from January 1970 through January 2019, a one-point increase in the MSCI USA Index’s price/earnings (P/E) ratio was associated with a 0.72% decrease in returns over the next year, while lower valuations had the opposite effect. Valuations could explain only a small part of the variation in stock returns over this period – 6% to be exact. So, the market’s current valuation says little about what its return over the next year will likely be.

    Case Study #1: MSCI USA Index

    It can take valuations a long time to revert to the mean, so it’s not surprising they appear to have greater explanatory power of returns over longer holding periods – though it’s still low. For example, with a three-year holding period, starting P/E ratios could explain 15% of the variation in the MSCI USA Index’s returns. The explanatory power was slightly higher over a five-year holding period, as shown in Exhibit 1.

    Stock Valuation Strategist

    So, why aren’t valuations a better predictor of returns?

    They aren’t the only variable that matters. Differences in expected growth rates can justify differences in valuations.

    As investors’ growth expectations increase, so do current valuations and stock returns. If they are realised, higher valuations don’t necessarily hurt returns going forward. And there are lots of surprises along the way (both good and bad), as business conditions change, that weaken the relationship between valuations and future returns.

    It’s also more challenging for value investing to work for tactical adjustments across regions, sectors, and factors than it is for stock selection because portfolios aren’t static.

    So, portfolio valuations are less comparable over time.

    Stock-Valuation

    Stock valuation strategy

    Using P/E ratios is not enough

    To test the efficacy of value-driven tactical adjustments, Alex created a strategy that compared the P/E ratios of the MSCI USA and MSCI World ex USA indexes once every three years (as it can take a long time for valuations to rebound). Whichever index had the lower valuation would receive a 60% weighting in the portfolio for the start of the three-year holding period, while the other would receive 40%. He chose to limit these tilts because it is always important to be diversified across both US and foreign stocks, regardless of valuations.

    This strategy didn’t help much. From the end of December 1974 through January 2019, it returned 11.15% annualised, while a static 50/50% split between the two indexes would have returned 11.04%. (The MSCI World Index returned 10.74% over this time.) This weak performance likely stems from the tenuous relationship between valuations and future returns.

    The results of valuation timing were even worse when applied to sectors and factors, though there is less data here. Certain sectors (and factors) persistently trade at lower valuations than others, so without any adjustments, using valuations to select sectors would lead to long-term sector biases. However, Morningstar research shows that value-driven sector tilts are a form of active risk that historically hasn’t been well-compensated.

    To mitigate persistent sector and factor tilts, Alex modified the strategy to measure the attractiveness of each sector and factor index based on how its current P/E compared with its average over the past five years, favouring those trading at the lowest levels relative to their own history.

    The sector strategy ranked the 10 sector indexes listed in Exhibit 2 on this metric and selected the three with the lowest values. It assigned an equal weighting to the indexes that made the cut and held them for three years before rebalancing. The factor strategy followed this same approach using the indexes listed in Exhibit 3. However, it selected the two indexes with the lowest valuations relative to their history.

    STock valuestock value

    The results for the sector and factor strategies are shown in Exhibits 4 and 5. The performance measurement periods start in November 2004 and December 2003, respectively, and run through January 2019.

    sector valuation strategyfactor valuation strategy

    In both cases, the results were disappointing. The sector strategy lagged a static equal sector allocation by 1.19 percentage points annually. Similarly, the factor strategy lagged an equal allocation across the factor indexes by 43 basis points annually (though it beat the MSCI USA Index by 18 basis points).

    As with the regional indexes, this largely owes to the weak relationship between relative valuations at the portfolio level and returns. However, it’s worth noting the value investment style was out of favour during much of this time.

    In practice

    Valuations are helpful for gauging expected returns, so it isn’t prudent to completely ignore them. If they’re unusually high, future returns will likely be lower than normal, and vice versa.

    However, it probably isn’t a good idea to use them to make big tactical adjustments among fund investments. The benefit will likely be modest at best and can easily be outweighed by lost diversification and tax efficiency.

    Stock-Valuation

    Consider using other methods when you evaluate stocks.

    Some popular stock valuation methods that professional analysts use are below.

    Take time to learn and see if it helps you to grow your wealth!

    stock valuation modelProfessional stock valuation strategiesProfessional stock valuation strategies